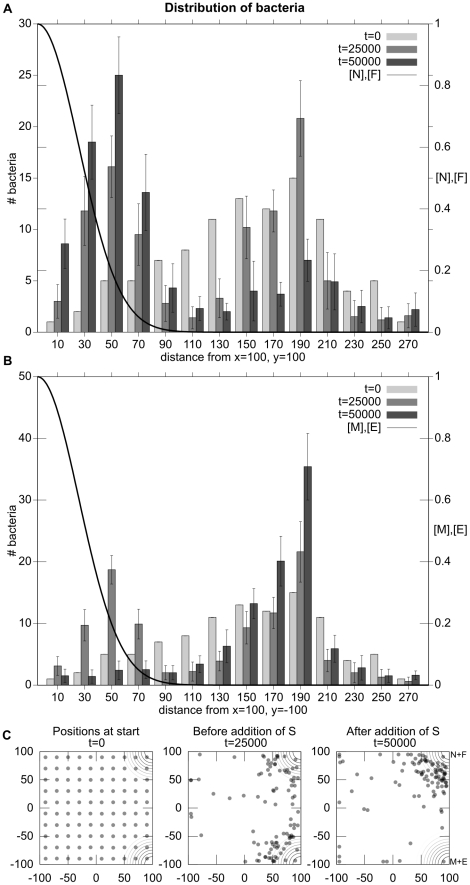
Figure 9. Experiment 3: Inhibition of a metabolic pathway inhibits chemotaxis only to the relevant resources.
Placed in an environment with two sets of metabolizable resources ( located in the lower-right and
  located in the upper-right), the simulated bacteria move from an initial, even-distribution to the areas higher in concentration of either resource-pair. The insertion of
  (a chemical that inhibits the metabolism of
  ) causes the simulated bacteria to cease chemotaxis towards the no-longer metabolizable resources without influencing chemotaxis to the other attractants. Histogram A illustrates average distance to the non-inhibited (
 ) source. Histogram B shows the distance from the inhibited source (
 ). As before, data is taken from 10 trials of 100 bacteria each. Plot C illustrates the spatial distribution of simulated bacteria in a typical trial.

