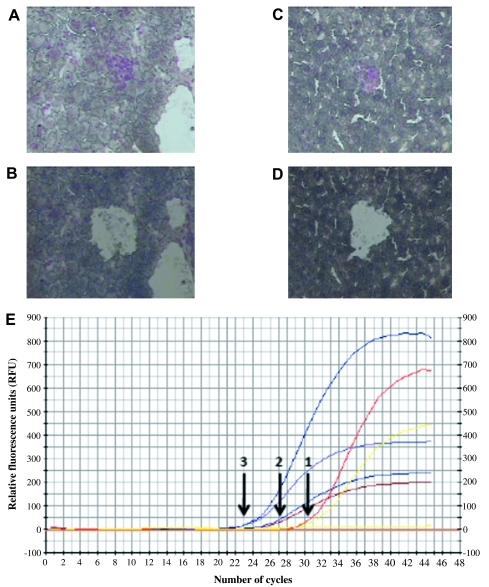
Figure 5.
Real-time reverse transcription (RT)-PCR for vascular endothelial growth factor (VEGF) expression from zone-separated hepatic micrometastases. (A, B) Representative photomicrograph of laser-capture microscopy (LCM) before (A) and after (B) of zone 1 micrometastases analysed for VEGF mRNA expression. (C, D) Representative photomicrograph of LCM before (C) and after (D) of zone 3 micrometastases analysed for VEGF mRNA expression. After normalisation to the internal control ß-actin (E), the ΔΔCt for VEGF expression in zone 3 versus zone 1 was 6.55. The ΔΔCt for VEGF expression in zone 3 versus zone 2 was 2.15. The ΔΔCt for zone 2 versus zone 1 was 4.4. This indicates a higher level of VEGF mRNA expression in zone 3 micrometastases versus zones 1 and 2. CF, curve fit; RFU, relative fluorescence units.

