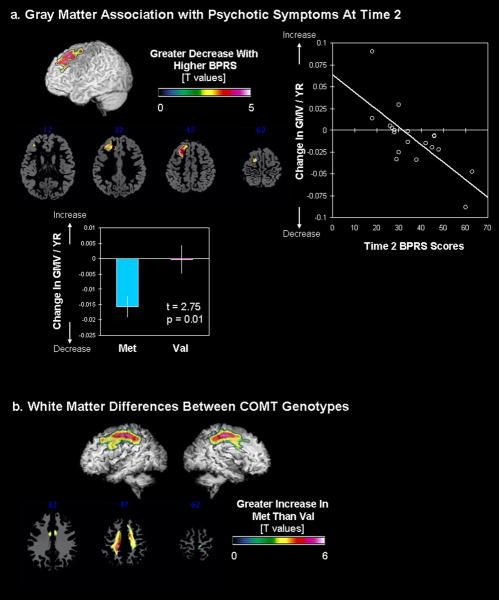
Fig. 3.
Covariation between brain regional volumes and Time2 psychotic symptoms and COMT genotypes. a. Brain regions that show significant correlation with GMV and Time2 BPRS scores (left). Extracted and adjusted brain volumes (for age and total GMV) are plotted against Time2 BPRS scores (right) as well as for COMTMet and COMTVal groups (below). b. Brain regions that show significant differences in WMV between COMTMet and COMTVal groups.

