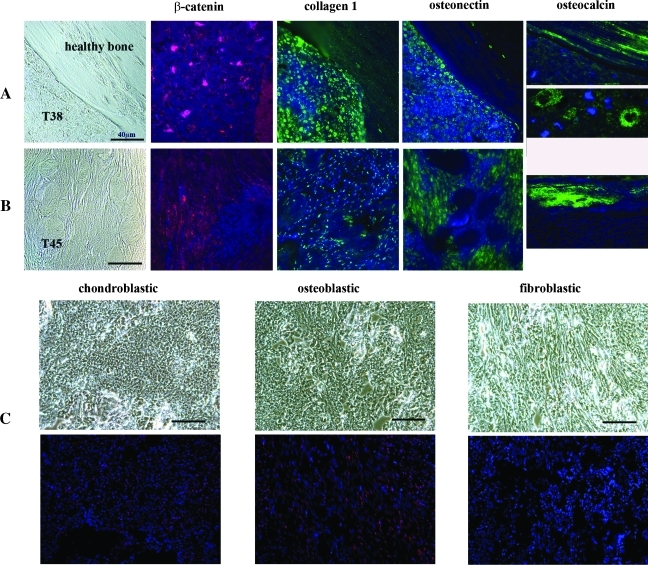
Figure 4.
Molecular signature of murine osteosarcomas combining Apc and twist haploinsufficiencies. (A) On the upper row, phase-contrast imaging (at the extreme left) and immunofluorescence staining of markers were performed on sections from a dense chrondroblastic osteosarcoma in the mouse named 38 (T38). Immunofluorescent detection of β-catenin is indicated by the red signaling located mainly within the T38 nuclei. Beside this figure, the collagen1 staining, which is labeled in green, is observed in the nuclei of tumor cells but also as parallel sheets in the healthy bone. Osteonectin, labeled in green on the fourth figure of the row A, is localized within the nuclei of T38 cells, whereas osteocalcin (at the extreme right of row A) is strongly green-labeled in the healthy part of the section (figure at the top and at the extreme right of row A) and at the border between malignant osteoblasts and the malignant osteoid matrix of T38 tumor (figure below and at the extreme right of row A). (B) On the second row, an osteolytic tumor (T45, a fibroblastic osteosarcoma from mouse named 45) is shown. As in row A, the phase-contrast image of row B is at the extreme left, followed by the immunofluorescence staining. The detection of β-catenin, labeled in red, is mainly located in the nuclei and the cytoplasms of T45 cells (second image of row B), whereas collagen1 staining in green is only observed in the nuclei of tumor cells (third image of row B). The fourth image represents the osteonectin green immunofluorescence, localized in the nucleocytoplasm compartment of T45 cells, whereas osteocalcin, labeled also in green, is undetectable in T45 tumor cells. An osteocalcin staining is present in the healthy bone section of T45 section. For panels A and B, DAPI, which labels the DNA, is indicated by the blue signal and is superimposed on the green or the red signals. (C) The detection of pRb, labeled usually in red, was performed in a chondroblastic (at the extreme left), in an osteoblastic (in the middle) and in a fibroblastic (at the extreme right) murine osteosarcoma. Phase-contrast images of the tumors are shown on the top of row C. DAPI, which stains the DNA, is indicated by the blue signal and is superimposed on the red pRb signal. In the chondroblastic osteosarcoma subtype, only a weak, diffuse nuclear signal of phosphorylated pRb is detected, whereas in the osteoblastic osteosarcoma, an accumulation of phosphorylated pRb is present in both nuclear and cytoplasmic compartments. No expression of pRb is observed in the fibroblastic subtype. The bars represent 40 µm on the different figures.

