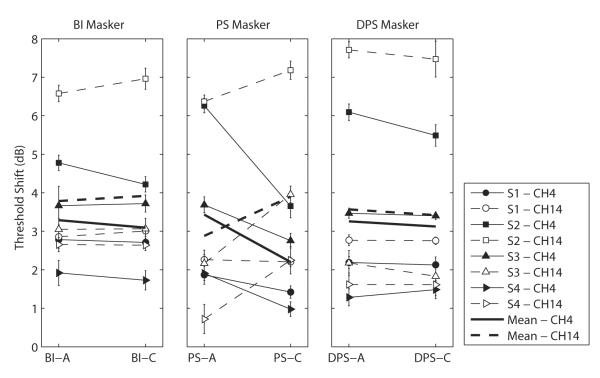
Fig. 6.
Each panel illustrates the threshold shift of a monopolar BI-C signal for each bipolar masker shape (left for BI, center for PS and right for DPS). Four conditions were performed for each masker shape: the signal was either presented on channel 4 (filled symbols) or 14 (open symbols) and the masker was either anodic-first (right part of each panel) or cathodic-first (left part) with reference to the most apical electrode (4) of the pair. Thick lines represent mean data of the four subjects.

