
Figure 2.
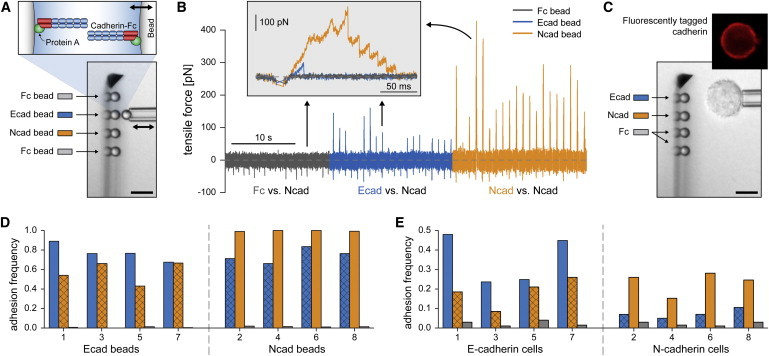
Summary of bead-bead (A, B, and D) and cell-bead (C and E) experiments. (A) A cadherin-coated, pipette-held test bead is probed against an array of four functionalized microspheres. Recombinant cadherin-Fc chimeras were attached to beads via surface-bound protein A (inset at top). The pipette-held bead is repeatedly moved to/from contact with one of the stationary cantilever beads (double arrow). (B) Examples of force-time curves recorded during bead-bead tests. Here, 20 cycles are shown for each tested interaction between a pipette-held Ncad bead and one of the three probe surfaces (Fc, Ecad, and Ncad). Adhesion events produce positive forces during retraction of the test bead. Homophilic Ncad:Ncad bonds form most frequently. (Inset) Enlarged view of superimposed individual test cycles (one of each interaction). High interaction forces are due to multiple bonds, as revealed by consecutive bond-rupture events in the Ncad-Ncad adhesion test (orange). (C) Bright-field videomicrograph of a cell-bead experiment. Also included is a fluorescent image of a pipette-held test cell, confirming expression of cadherin. (D and E) Adhesion frequencies from contacts between different combinations of probe beads and either test beads (D) or test cells (E). (Note that the y scales are different.) Colors encode the specific probe surfaces of the cantilever beads (see legends in A and C). Overlaid crosshatch patterns highlight heterophilic E:N-cadherin binding. Numbers on the x axes indicate the chronological order in which the data sets were gathered. (Bars in panels A and C denote 10 μm.)