
Figure 1.
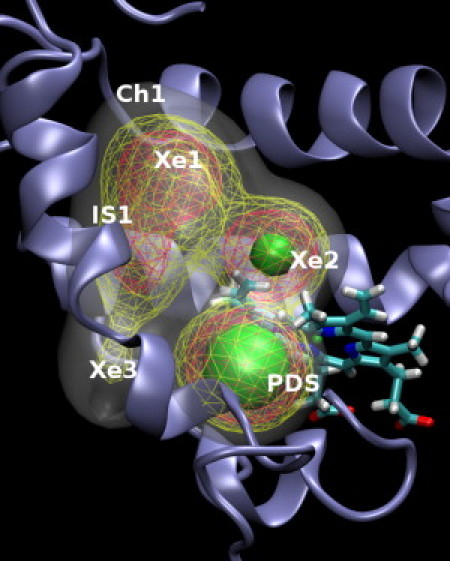
Distribution of NO ligand density in trHbN. The protein is shown in ribbon, and heme is shown in stick representation. The ligand density is shown as an isocontour mesh, with increasing ligand density reflected by gray, yellow, orange, and green colors.