
Figure 6.
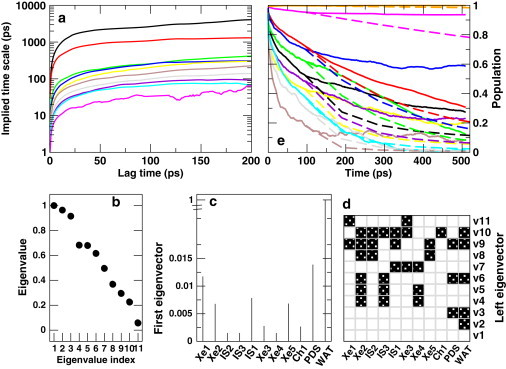
(a) Implied timescale (see Eq. 4) obtained from the TM (T) of ligand migration in trHbN as a function of lag time (τ). (b) Eigenvalue spectrum, (c) the first (left) eigenvector, (d) all eigenvectors of the TM at τ = 100 ps. The solid and open boxes indicate whether the eigenvector component is negative or positive, respectively. (e) Population dynamics of the docking sites obtained from TNA (solid lines) and the Markov model (dashed lines); see Eq. 3. The color-coding is identical to that in Fig. 3.