
Figure 2.
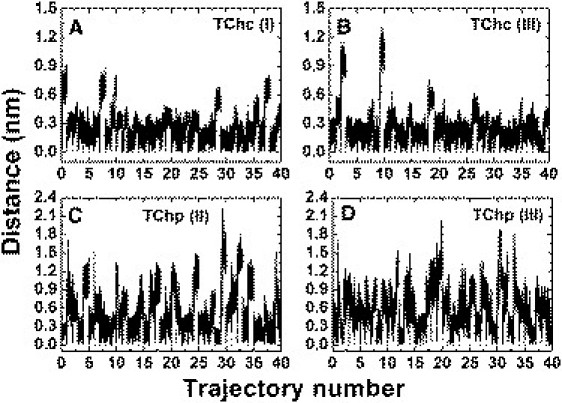
Distances of TChC and TChP from their starting points in sets of 20-ns MD simulation trajectories. Each panel shows 40 such trajectories, displayed sequentially, showing, for each trajectory, snapshots extracted at 1-ps intervals. They have the same starting coordinates, but their velocities (speed and direction) are randomly selected. (A) TChC in group I; (B) TChC in group III; (C) TChP in group II; and (D) TChP in group III. Each trajectory has a duration of 20 ns, and the distances were calculated based on the snapshots extracted at 1-ps intervals.