
Figure 3.
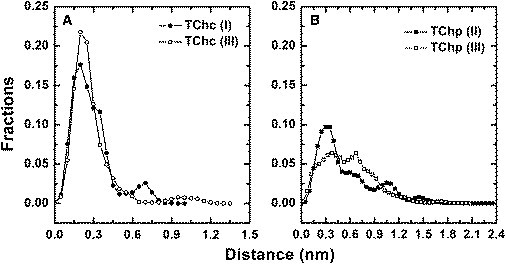
Histograms of the distances of TChC (A) and TChP (B) from their starting points. The individual distances were extracted from the MD simulations presented in Fig. 2. Each histogram thus contains 800,000 data points compiled from the 1-ps snapshots in each of the 40 MD simulations of 20-ns duration, and presents data taken from the appropriate panel in Fig. 2.