
Fig. 6.
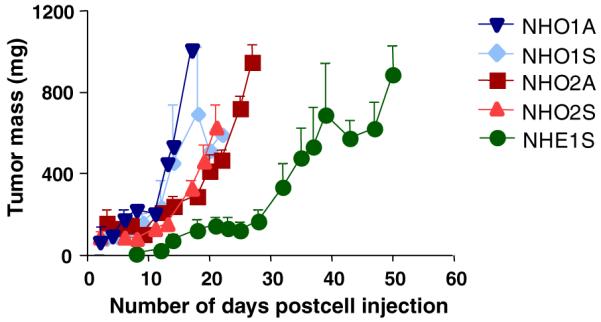
Engraftment of murine neuroblastoma cell lines into nude mice. Single cell suspensions from NHO1A (▼), NHO1S (◆), NHO2A (■), NHO2S (▲) and NHE1S (●) at 5 × 10⁶ cells per graft were inoculated into both flanks of nude mice at day 0. The tumour development was monitored for up to 50 days by measuring with vernier calipers, and tumour mass (mg) was calculated using the formula shown in Section 2. Data shown here are means ± SE of three grafts on two separate mice.