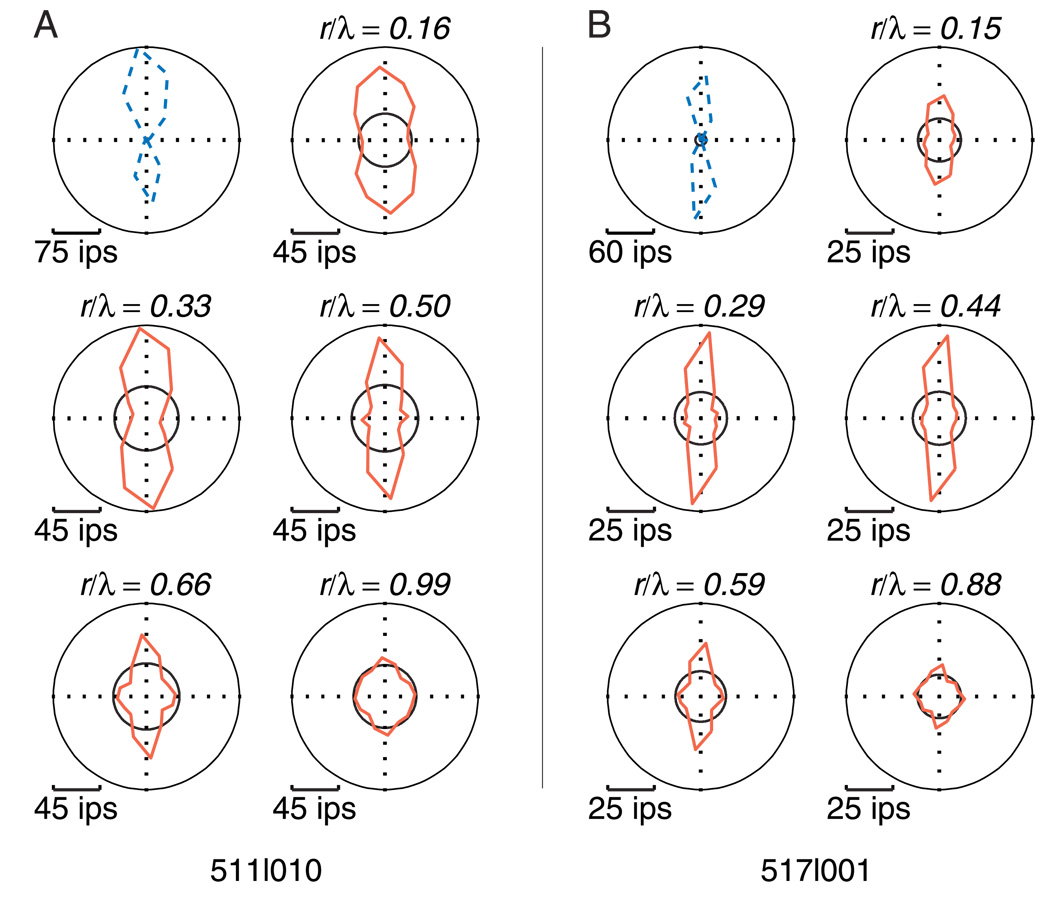
Figure 1.
Sample responses of two V2 neurons. (A and B) The left and right panels of this figure show the responses of two V2 neurons to gratings and Glass patterns. The direction tuning for drifting sinusoidal gratings is shown in the polar plot in the upper left of each panel with a blue dotted line. Translational Glass pattern tuning curves taken at multiple dot separations (r) are shown in the remaining plots with red solid lines. The values of r/λ are indicated at the top of each polar plot. The black circles on each polar plot represent baseline responses, consisting of a blank gray screen for gratings and random dots for Glass patterns. The Glass pattern polar plots are presented with a different scale than the grating to better show their features.

