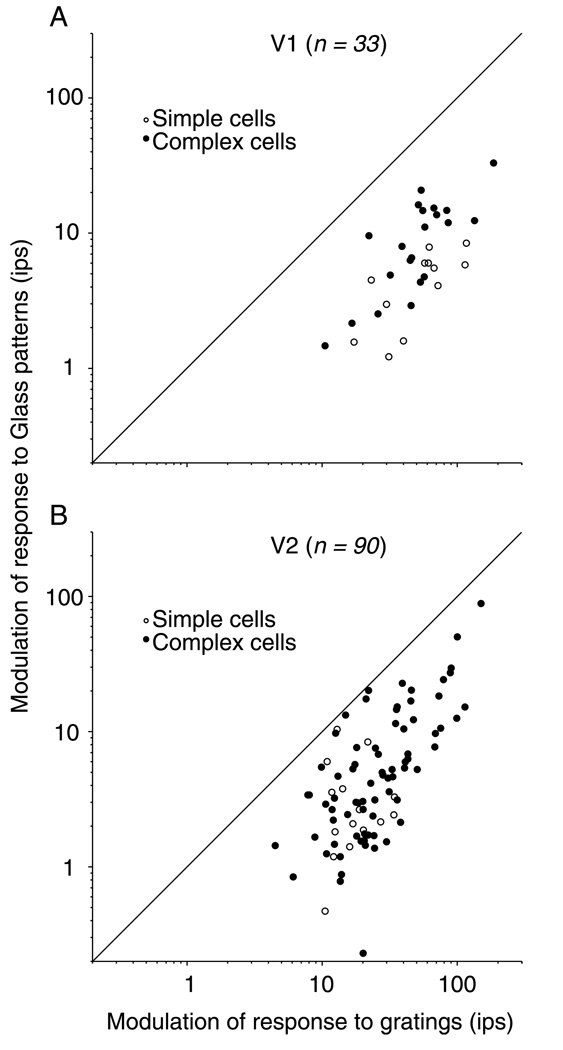
Figure 3.
Responses to Glass patterns and gratings in V1 and V2. (A) For each cell, we defined the response modulation to be the maximum response minus the minimum response (or the peak minus the trough of the orientation tuning curve). For Glass patterns, we used the tuning curve taken at the optimal dot separation. Responses are plotted for both complex cells (filled circles) and simple cells (open circles) in V1. All points fall below the diagonal line of equality, indicating that all cells responded better, that is, had more modulated tuning curves, to gratings than to Glass patterns. (B) In V2, the trend shown is similar to that shown in Panel A.

