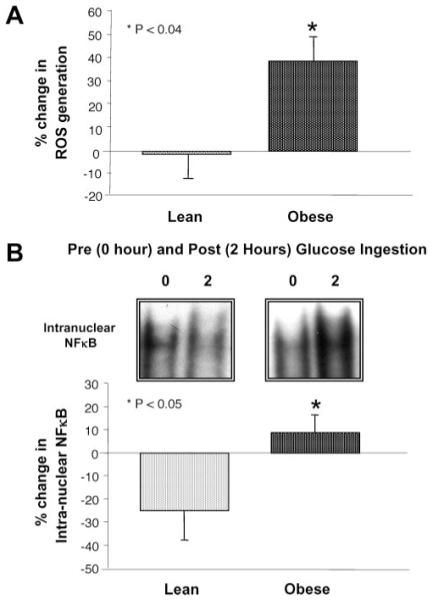
Figure 2.

(A) The percentage change in ROS generation from mononuclear cells (MNC) when fasting samples (pre) were compared with the samples collected 2 hours after glucose ingestion (post). * ROS generation in the obese group was significantly greater compared with lean controls (p < 0.04). (B) Representative bands from the electrophoretic mobility shift assay showing the change in quantity of NFκB in nuclear extracts, and densitometric analysis of intra-nuclear NFκB protein content from MNC when fasting samples (pre) were compared with the samples collected 2 hours after glucose ingestion (post). * The percentage change in intra-nuclear NFκB was significantly greater in the obese group compared with lean controls (p < 0.05).
