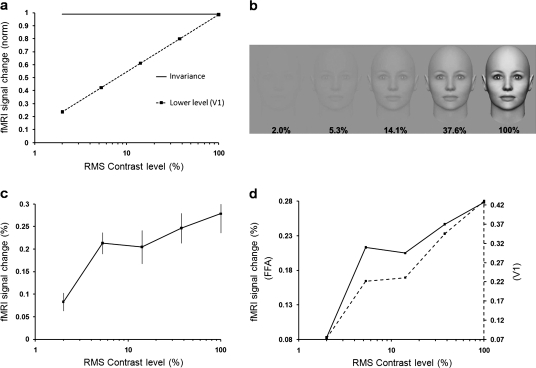
Figure 3.
Responses to variations in facial contrast. (a) Hypotheses for changes in FFA activity due to variations in contrast level of face stimuli. The “contrast invariance” hypothesis is shown as a solid line. Alternatively, FFA responses might increase with increasing contrast, as in the V1 prediction (dashed line), based on grating stimuli (from Tootell et al. 1995). (b) Stimulus examples. (c) FFA activity to faces increases at progressively higher contrast (relative to the uniform gray baseline stimuli), similar to the V1 prediction based on gratings (dashed line in panel a). (d) Based on the face stimuli, the contrast gain response in FFA (solid line) was similar to that in V1 (dashed line). The contrast levels shown here are not exact due to lack of control over publication displays.

