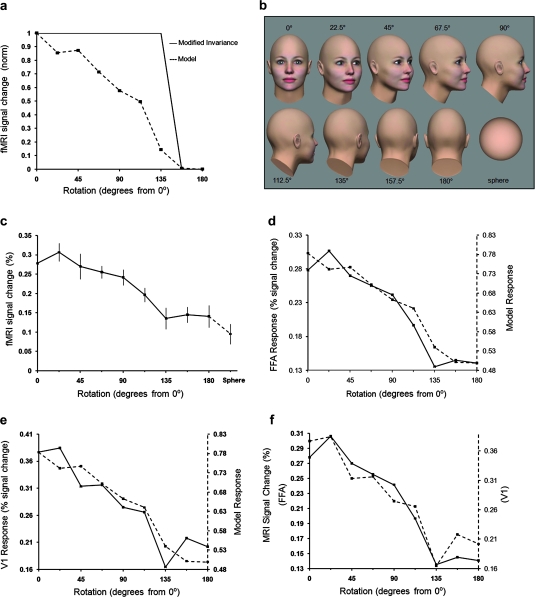
Figure 4.
Response to variations in face viewpoint (rotation in depth). (a) Two hypotheses for FFA activity. The solid line shows the rotation-limited invariance hypothesis. Since the face is occluded beyond 0 ± 135°, a baseline response is predicted to those stimuli. The second hypothesis (dashed line) is the prediction from the lower-order model incorporating the contrast and CMF influence in FFA. (b) Stimulus examples. Half of the tested rotations are illustrated; the remaining stimuli are mirror symmetrical. We also tested the responses to a sphere similar in size to the back of the head (bottom right). (c) fMRI responses in FFA. Results from left and right rotation angles have been combined. Normalized responses to the sphere are shown in dashed line. (d) The variation in FFA response (solid line) correlated well with the variation produced by the model (dashed line). (e) An analogous result was found in V1. (f) Responses from FFA (solid line) and V1 (dashed line) correlated highly.

