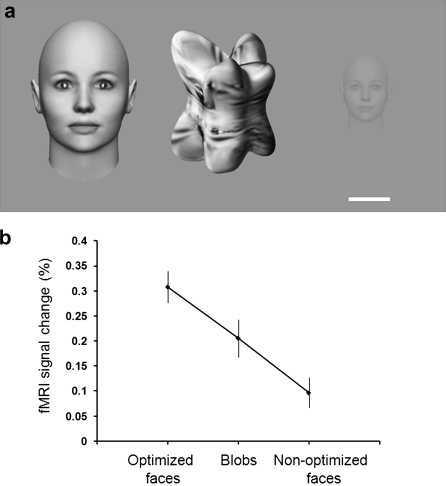
Figure 5.
Sensitivity to stimulus category and parameters. (a) Examples of the stimuli from left to right: 1) optimized faces (12.7° diameter, 100% contrast); 2) computer-generated objects (“blobs”), with lower-level features matched to the optimized faces; 3) nonoptimized faces (1.02° diameter; 14.14% contrast). The white scale bar represents 1° for the nonoptimized face and 6.3° for the blob and optimized face. (b) Average FFA response to each stimulus type.

