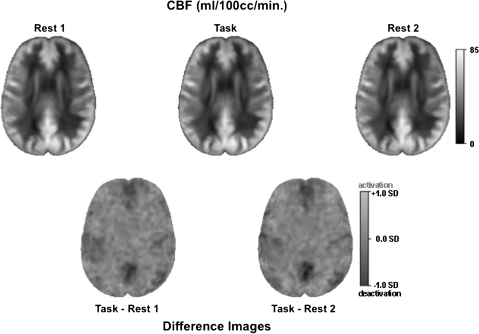
Figure 1.
CBF images averaged across the 14 subjects. Top, left to right: example slices in the axial plane from each ASL condition: Rest 1, Task, and Rest 2. CBF is displayed as image intensity ranging from 0 to 85 mL/100cc/min. Bottom: examples of average difference CBF images at the same slice location as the single ASL condition above. Normalized difference in CBF is displayed as signal intensity ranging from deactivation (dark) to activation (bright) in SDs.

