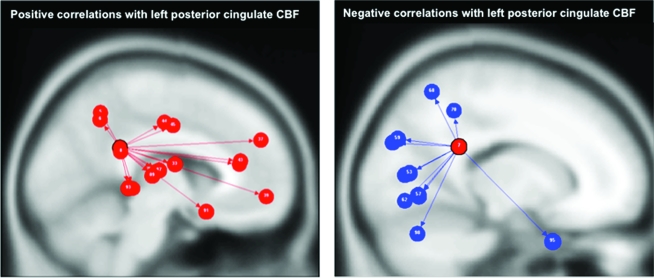
Figure 6.
Rest–Task–Rest temporal connectivity. Top: regions with temporal fluctuations (Rest–Task–Rest) that correlated positively (P < 0.05 FDR) with left posterior cingulate CBF, that is, regions of task-dependent CBF deactivation. Bottom: regions with temporal fluctuations (Rest–Task–Rest) that correlated negatively with left posterior cingulate CBF, that is, regions of task-dependent CBF activation. Table 2 presents the connectivity statistics.

