
Figure 8. CO2-dependent gating of Cx26 in isolated patches.
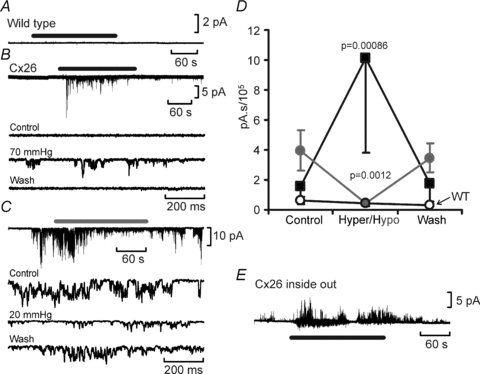
A, no changes in channel gating in response to an increase in  to 70 mmHg (bar) were seen in patches drawn from wild-type cells. B, patches drawn from Cx26-expressing cells demonstrated a reversible increase in channel openings in response to an increase in
  to 70 mmHg (bar). Expanded traces from before during and after the CO2 stimulus shown below. C, reversible reduction of channel gating in response to a decrease of
  to 20 mmHg (grey bar). Expanded traces from before during and after the CO2 reduction shown below. D, summary graph showing the reversible change in the current integral recorded from the membrane patches drawn from Cx26-expressing cells in response to increases (black, hyper, n = 8) and decreases (grey, hypo, n = 7) of
  . The changes are highly significant (Friedman's two way ANOVA). The black trace shows the lack of any change in the current intregral for patches drawn from wild-type cells (increase of
  , n = 10). E, increase in channel gating of Cx26 in an inside out membrane patch in response to increasing
  to 70 mmHg (bar). A small conductance outward current was present in this patch (downward deflections below baseline).