
Figure 2. Tension tests on diaphragmatic tissue strips.
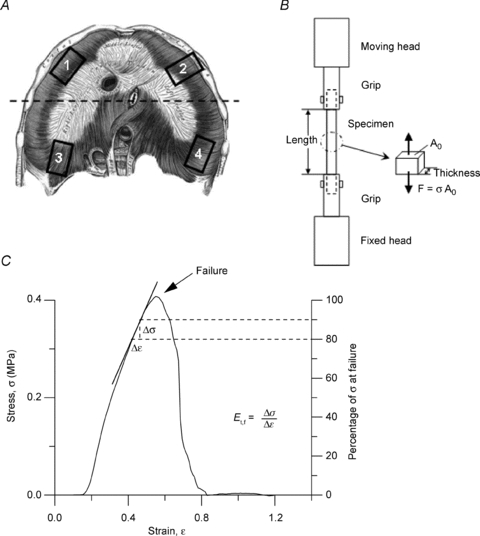
A, schematic drawing of the diaphragm with indication of the site of excision of the tissue strips: 1, ventral zone, transversal to major fibres axis; 2, ventral zone, longitudinal with respect to fibres axis; 3, dorsal zone, longitudinal to major fibres axis; 4, dorsal zone, transversal to fibres axis. B, schema of the apparatus used for tension test on diaphragmatic tissue strips. F, force measured by the machine; Ao, initial sample resistant area; σ, resulting stress. C, typical stress (σ)–strain (ɛ) plot until failure (arrow) of a diaphragmatic tissue strip. The elastic modulus before failure, Et,f, was graphically represented by the slope of the tangential line to the stress–strain curve at a stress of 80 to 90% of the failure stress (Failure = 100% on the right Y axis). Mathematically, Et,f was obtained as:  .
.