
Figure 4. Pressure–volume behaviour of submesothelial lymphatics.
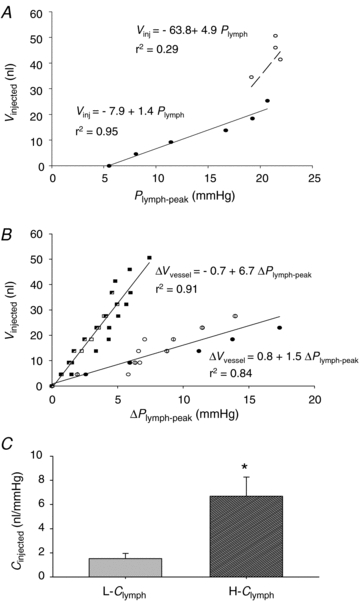
A, example of the relationship between cumulative injected volume (Vinjected) and Plymph-peak attained after each injection in a single experiment. The continuous line identifies the highly significant linear regression through the initial data points (filled symbols). At further injections and larger cumulative injected volumes (open symbols), Plymph-peak was almost unchanged suggesting fluid leakage through vessel discontinuities. B, plots obtained by pooling data from all lymphatic segments (represented by different symbols), where Vinjected is plotted as a function of ΔPlymph-peak to account for the physiological variability of individual pre-injection Plymph. The data points appear distributed in two distinct populations characterized by a significantly (P < 0.005) different Clymph amounting to 6.7 nl mmHg−1 (high compliance, H-Clymph) and 1.5 nl mmHg−1 (low compliance, L-Clymph), respectively. C, comparison between absolute L-Clymph and H-Clymph values, expressed in nl mmHg−1. Bars represent means ± s.e.m. *Significantly different (P < 0.001) from L-Clymph.