
Figure 5. Diaphragmatic tissue mechanical parameters.
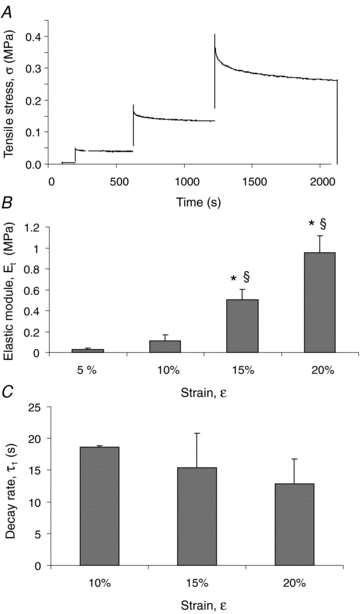
A, typical stress–relaxation curve following stretch of a diaphragmatic strip. The stress (σ) increased when the strain ramp was applied until attainment of the strain peak; thereafter, the tissue relaxed while the stress decreased to an equilibrium value during the constant strain phase. Stress–relaxation data allow calculation of elastic moduli Et and the relaxation time constants (τ) for all of the tested strain levels. B, average values of the elastic modulus (Et) for increasing strain (ɛ) level, expressed as percentage of initial strip length, of all the tested specimens (n = 28). C, average values of the first relaxation (τ1) constant (n = 28). Bars represent means ± s.e.m. *Significantly different (P < 0.01) from values at 5% strain; §significantly different (P < 0.01) from values at 10% strain.