
Figure 6. Regional mechanical characterization of diaphragmatic tissue strips.
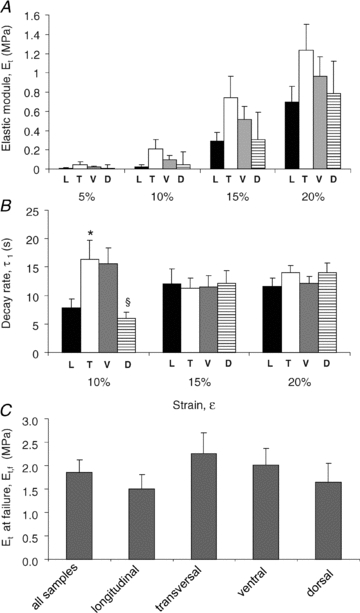
Elastic modulus, Et (A), and relaxation time constant, τ1 (B), for increasing strain (ɛ) levels grouped by direction of fibre orientation and by anatomical location. Black bars: strain applied longitudinally to the fibres axis (L); white bars: strain applied transversally to the fibres axis (T); grey bars: strips excised from the ventral zone (V); striped bars: strips excised from the dorsal zone (D). C, average elastic modulus before failure, Et,f, of all samples grouped by fibre direction or location. Et,f was measured as the slope of the linear portion of the curve before failure, as graphically shown in Fig. 2C. *Significantly different (P < 0.01) from longitudinally elongated fibres; §significantly different (P < 0.01) from ventral fibres.