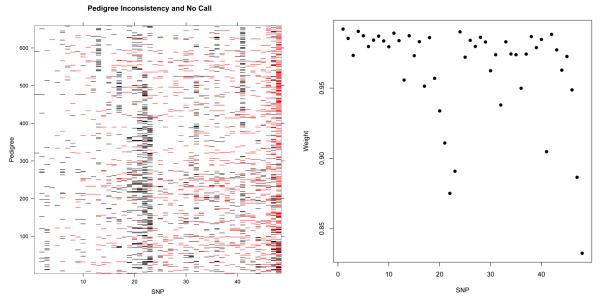
Fig. 4.
Left: Representation of pedigree inconsistent genotype configurations (red) and genotyping failures (black) for 659 trios across 48 SNPs. The low number of pedigree inconsistent genotype configurations for the first seven SNPs are due to the low allele frequencies (< 5%). A trio is considered to experience a genotyping failure at a SNP if at least one of three individuals has a missing genotype at this SNP. We have ordered the markers by increasing number of mendelian errors. Right: Plot of the Nucl3ar inferred weighting for each of the 48 SNPs used in the analysis. The SNPs which have significantly lower weightings corresponded correctly to SNPs with greater extent of pedigree inconsistent genotype configurations.

