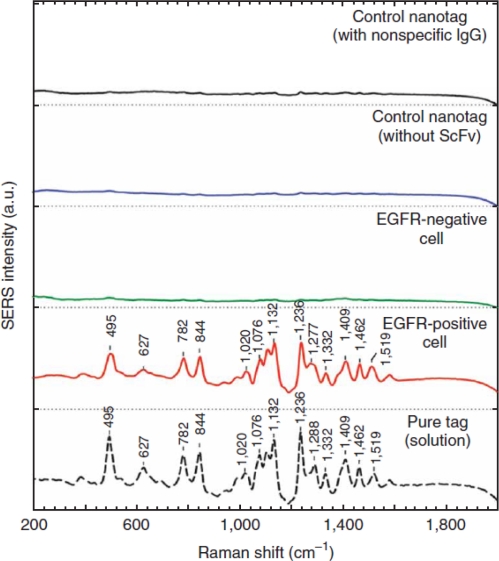
Figure 11.
SERS spectra obtained from EGFR-positive cancer cells (Tu686) and from EGFR-negative cancer cells (human non-small cell lung carcinoma NCI-H520), together with control data and the standard tag spectrum. All spectra were taken in cell suspension with 785-nm laser excitation and were corrected by subtracting the spectra of nametag-stained cells by the spectra of unprocessed cells. The Raman reporter molecule is diethylthiatricarbocyanine (DTTC), and its distinct spectral signatures are indicated by wavenumbers (cm−1). © 2010 Nature Publishing Group.

