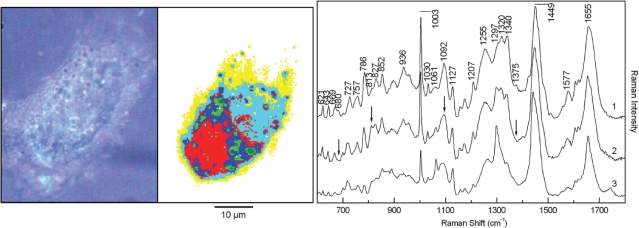
Figure 3.
Photomicrograph of formalin-fixed lung fibroblast cell in buffer (left), Raman image after segmentation by cluster analysis (middle), Raman spectra (right) representing the nucleus (trace 1: red cluster), the cytoplasm (trace 2: cyan cluster) and lipid vesicles (trace 3: green cluster). © The Royal Society of Chemistry.

