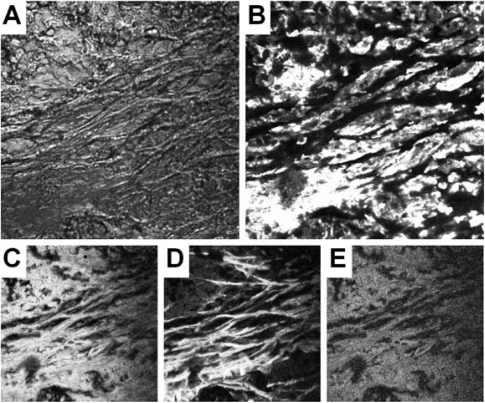
Figure 6.
Complementary epi-detected confocal images from the same 212 μm square region of a 20 μm thick sample of cancerous breast tissue. (a) Differential interference contrast (DIC), (b) CARS tuned to 1,662 cm−1, (c) two-photon fluorescence (2PEF), (d) second harmonic generation (SHG), (e) sum frequency generation (SFG). Images (b) and (e) were acquired simultaneously, with 11 mW of 1,064.4 nm and 16 mW of 904.4 nm (measured at the sample), all other images were acquired sequentially with illumination only at 904.4 nm. All pixel dwell times were 61 μs (except ‘a’: 1.7 μs), and all images were 512 × 512 pixels. The scan unit dichroic mirror was at 870 nm, the dichroic mirror in the filter block (Photomultiplier detector unit) was at 670 nm. Further short pass filters were applied before ‘b’ (800 nm) and ‘c’, ‘d’, ‘e’ (660 nm). Band pass filters were at 800 nm (width 30 nm) in ‘b’, 535 nm (width 30 nm) in ‘c’, 460 nm (width 50 nm) in ‘d’, 480 nm (width 30 nm) in ‘e’. © John Wiley & Sons, Ltd.

