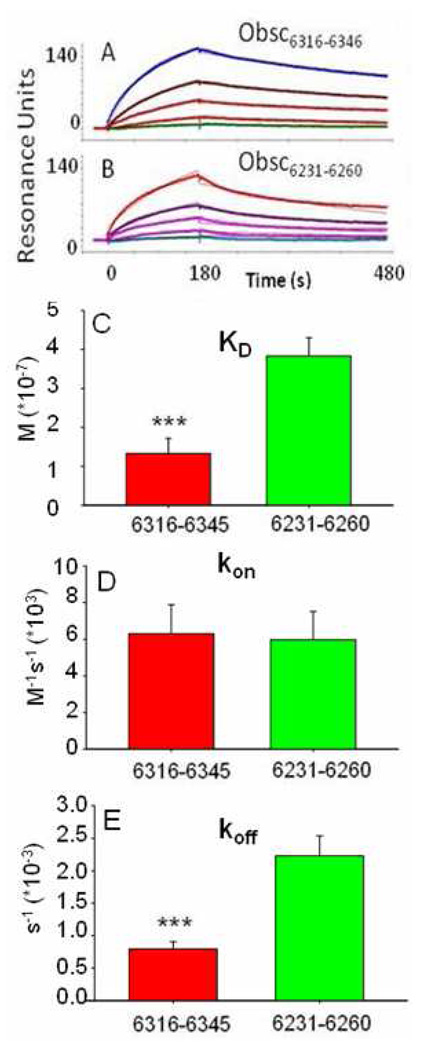
Fig. 2. Kinetics of binding of GST-Obsc6231–6260 and GST-Obsc6316–6345 to MBP-sAnk129–155.
(A, B) Colored curves show binding of serial diluted concentrations of MBP-sAnk1 starting at 3µM to GST-Obsc6316–6345 (A) and GST-Obsc6231–6260 (B). Black curves are fits based on a 1:1 stoichiometry of binding. (C–E) Bar graphs of values of KD, kon, and koff for GST-Obsc6316–6345 A (red) and GST-Obsc6231–6260 (green). *** denotes p < .05. n = 5 for all values.

