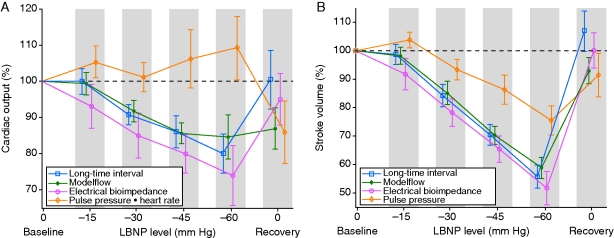
Fig 1.
(a) CO metrics and (b) SV metrics. Group means of subjects (n=21) for the investigative metrics through progressive levels of LBNP decompression, expressed as per cent of subject's baseline value. Vertical positions of data points are staggered to display non-overlapping 95% CIs. After 60 mm Hg, some subjects progressed to −70 and −80 mm Hg before their recovery; see text for details.

