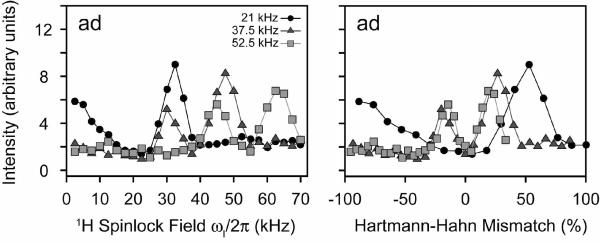
FIGURE 10.
PMPT experiments on the NAL single crystal. The 1H spinlock field was varied between 0–70 kHz for three different 15N spinlock fields (21, 37.5, and 52.5 kHz). The values are also plotted as the Hartmann-Hahn mismatch percentage. The mixing time was fixed at 10 msec for all points. Cross-peak intensities are plotted in arbitrary units. The dip in the curves is due to the Hartmann-Hahn match. The other cross-peaks are essentially the same as that plotted for the cross-peak ad. All other curves are shown in Supplementary Figures 17 and 18.

