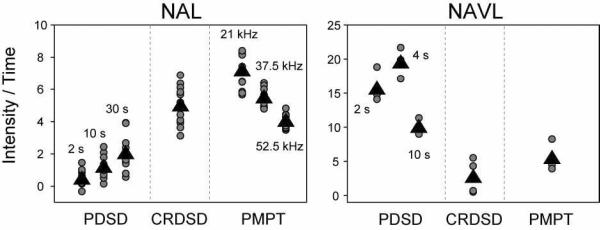
Figure 14.
Comparison of PDSD, CRDSD, and PMPT experiments for NAL and NAVL normalized for the mixing time in the PDSD experiment. Since a 3 sec recycle delay was used for every experiment, normalization was done by dividing the PDSD 2D peak intensities by 1.29, 1.53, 2.08, and 3.32 to account for 2, 4, 10, and 30 sec mixing times, respectively. Although the PMPT experiment used a 3 sec Z-filter time, no normalization was done for this experiment due to the fact that a much shorter time can be used that would only marginally influence the experimental acquisition time.44 For NAVL, much of the magnetization created in the PMPT experiment originated from the 3 sec Z-filter time. Circles represent all cross peaks observed in the NAL spectra and only intramolecular 15N/15N cross-peaks in the NAVL crystal (i.e., peaks ac, ca, bd, and db). Triangles represent the average of the cross-peak intensities shown (values in Table I). The CRDSD experimental cross-peaks are from the spectra using a 10 msec mixing time with a 15N spinlock of 21 kHz (both NAL and NAVL). The PMPT experimental cross-peaks are from the 10 msec mixing time with the indicated 15N spinlock for NAL and the optimized 1H spinlock used in Figure 11. For NAVL, the PMPT experiment used the 10 msec mixing time with 1H and 15N spinlocks of 65.8 and 57.5 kHz, respectively (same as in Supplementary Figure 19). It is not appropriate to compare the intensities between NAL and NAVL, as the crystal sizes were different.

