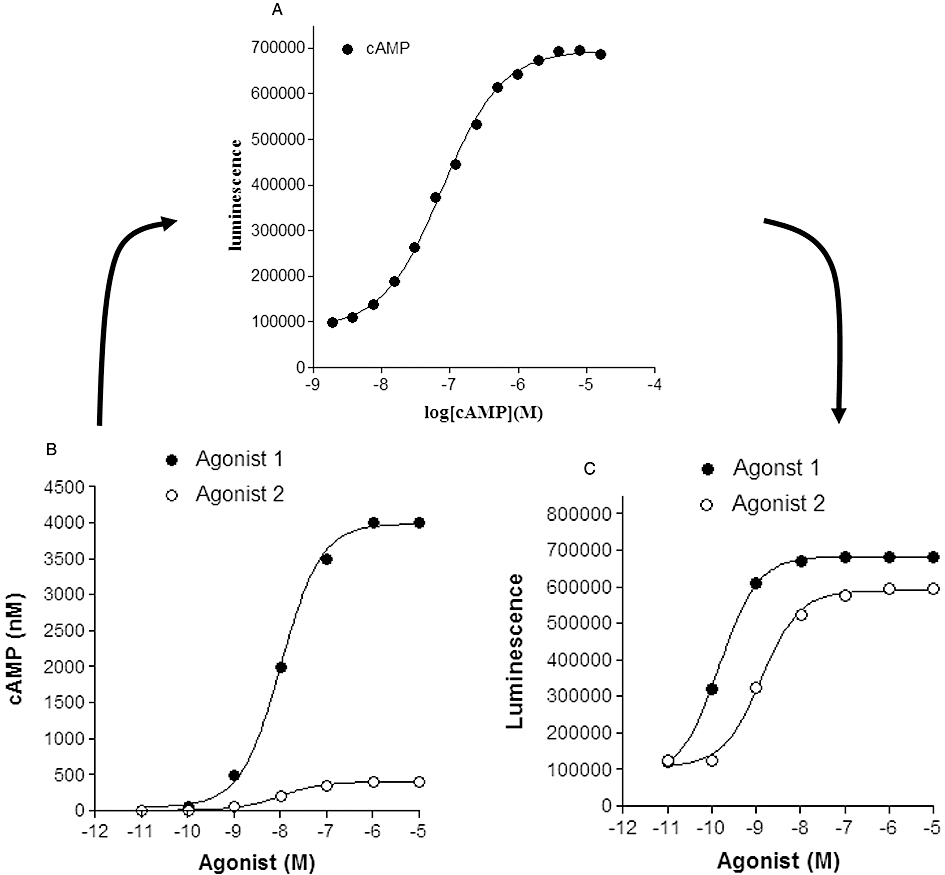
Figure 1.

Influence of cAMP standard curves on the relationship between agonist concentration and measured response (cAMP or luminescence activity). (A) A cAMP standard curve determined for a competitive immunoassay-based enzyme complementation assay for cAMP (HitHunter, DiscoveRx). In this assay, cAMP competes for antibody binding against a cAMP analogue that is conjugated to a small peptide fragment of β-galactosidase. In the absence of free cAMP, the majority of this galactosidase conjugate of cAMP is captured by the antibody and is therefore unavailable for complementation to a larger fragment of β-galactosidase resulting in a low signal output. In the presence of free cAMP, antibody sites are occupied, leaving the cAMP conjugate free to complement with the large fragment of β-galactosidase, forming an active β-galactosidase enzyme that leads to substrate hydrolysis and the production of a chemiluminescent signal. Data points (Dr J.G. Baker, unpubl. data) are the mean of 6 replicates at each concentration of cAMP. (B) Simulated concentration–response curves for two agonists with a log EC50 of −8.0 and maximal responses that differ by one order of magnitude (i.e. generating cAMP levels in each well of 400 and 4000 nM). (C) Resultant concentration–response curves generated from the concentration–response curves in (B) when converted to luminescence activity via interpolation from the cAMP standard curve in (A). Log EC50 values obtained in (C) were −8.9 and −9.8 for agonists 2 and 1 respectively.
