
Figure 3.
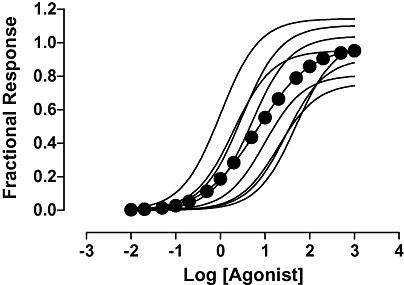
Eight concentration–response curves were simulated with Hill coefficients of 1, random maximal responses which varied between 0.75 and 1.25 and midpoints which varied systematically over the range 1–50. A Hill function was fitted to the data for all eight concentration–response curves and gave a Hill coefficient 0.73. Similar results were obtained whether the maximal response was constant or also varied systematically. Pooling only resulted in a Hill coefficient of unity when the potencies of the pooled curves were identical.