
Figure 4.
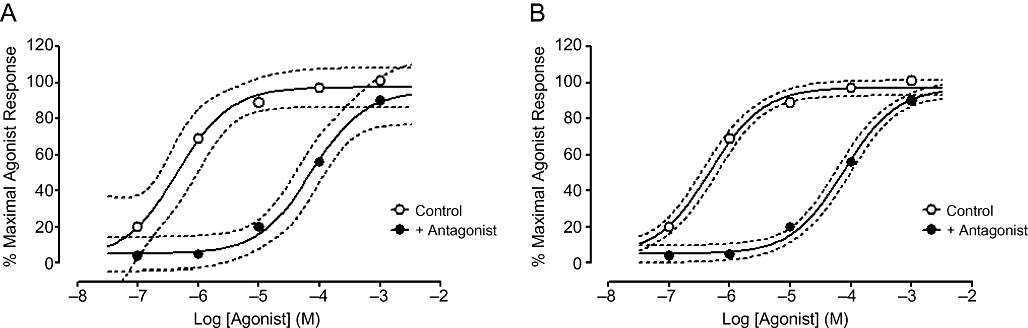
Individual (A) or global (B) fits of control and antagonist-treated concentration–response curves according to a three-parameter logistic equation. 95% confidence intervals of the fitted curves are shown using dashed lines.
Official websites use .gov
A
.gov website belongs to an official
government organization in the United States.
Secure .gov websites use HTTPS
A lock (
) or https:// means you've safely
connected to the .gov website. Share sensitive
information only on official, secure websites.
Individual (A) or global (B) fits of control and antagonist-treated concentration–response curves according to a three-parameter logistic equation. 95% confidence intervals of the fitted curves are shown using dashed lines.