
Figure 6.
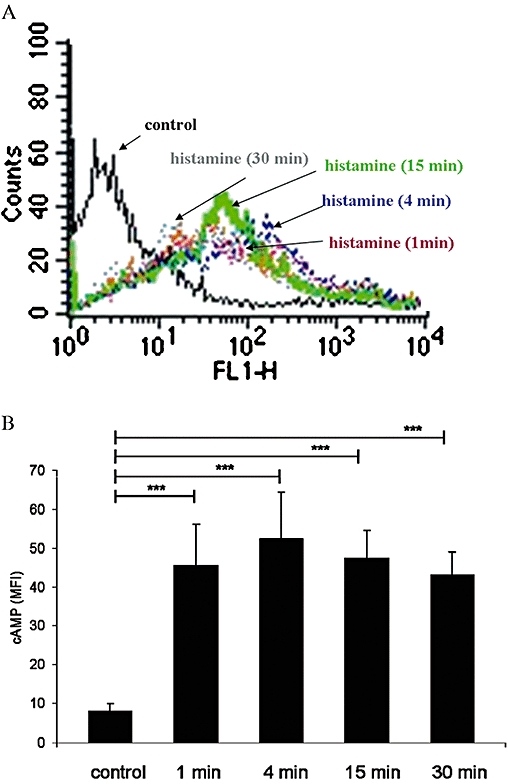
Effect of histamine on intracellular cAMP levels in human peripheral blood γδ T cells. (A) Distribution of fluorescence intensity in control cells and γδ T cells stimulated with 1 µM histamine for 15 min is shown. Aliquots of cells were fixed and stained as described in Methods. The fluorescence intensity was measured by flow cytometry. Representative data of one experiment are shown; experiments were performed three times in triplicate. (B) Time course of cAMP levels after stimulation with 1 µM histamine. Experiments were repeated five times with γδ T cells isolated from different donors. Data are means ± SEM (n= 5) (***P < 0.0001). MFI, mean fluorescence intensity.