
Figure 6.
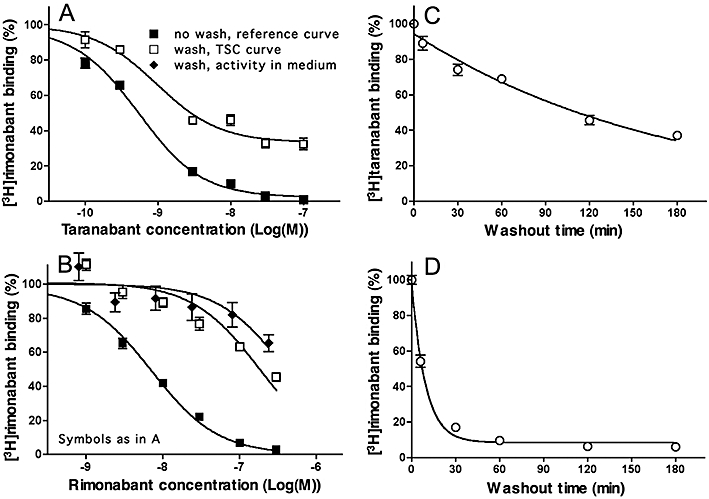
Experiments. Taranabant and rimonabant dissociation from CB1 cannabinoid receptors: different approaches. (A, B): TSC approach. HEK293-CB1r cells were pre-incubated for 30 min at 37°C with increasing concentrations of taranabant (A) or rimonabant (B) followed by a brief wash or not. For the reference and TSC curves, [3H]-Rimonabant (5 nM, final concentration) was then added and the incubation was continued for 60 min. Alternatively, to check for cellular uptake and subsequent release of rimonabant in the medium, washed cells were incubated with fresh medium for 30 min, the supernatants were collected and added along with 5 nM [3H]-rimonabant (final concentration) to naïve cells. The mixture was further incubated for 60 min at 37°C. For comparison with the TSC curves, the inhibitory activity in these supernatants is expressed as a function of the initial antagonist concentration in the pre-incubation step. Data refer to specific binding expressed as percentage of control binding (i.e. specific binding to cells pre-incubated with medium only) and are presented as means ± SEM of at least three individual experiments with three determinations each. (C, D): Radioligand dissociation experiments. Cells were pre-incubated for 60 min at 37°C with 2 nM [3H]-taranabant (C) or 5 nM [3H]-rimonabant (D), washed and further incubated for the indicated time periods at 37°C with 5 nM unlabelled rimonabant (washout phase). Data refer to specific binding expressed as percentage of control binding (i.e. specific binding at the very onset of the washout) and are presented as means ± SD of two individual experiments with three determinations each. Curves are monoexponential and constrained to zero at long times (C) or not (D). TSC, two-step competition.