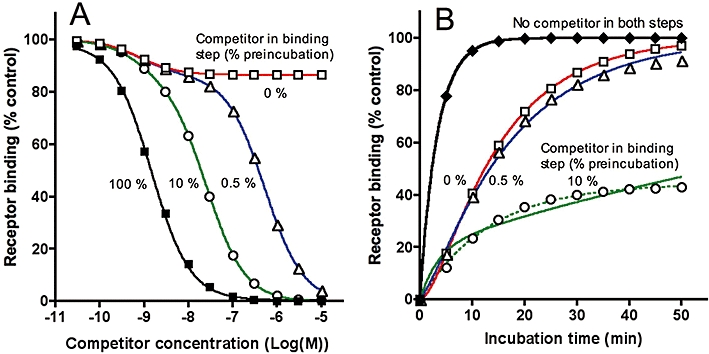
Figure 7.

Simulations. Pre-incubation of receptors with a fast-dissociating competitor followed by a wash-step: effect of the release of adsorbed competitor in solution on subsequent radioligand binding. Competitor and radioligand parameters, radioligand concentration and incubation times are given in Table 1. Calculations of k4 (given below as the corresponding t1/2) were based on Equation 5 (A) and 4 (B). (A) For simulating the TSC data, receptors are pre-incubated for 30 min with different concentrations of competitor, washed and further incubated for 30 min with a fixed concentration (2 nM) of radioligand either in the absence (0%) or presence of still remaining competitor at the indicated fractions of its initial concentration. Radioligand binding is expressed in percent of control, i.e. binding to receptors pretreated with medium only (i.e. [LR]c=0). [LR]cmax/[LR]c=0 ratios obtained by non-linear regression analysis varied little: that is, 0.866 (red curve, for 1-site competition), 0.867 (blue curve, for 2-site competition) and 0.863 (green curve, for 2-site competition). The calculated competitor dissociation t1/2 values (8.9–9.1 min) according to Equation 5 were close to the input value (9.0 min). The lower potency component of the green and blue TSC curves were shifted 17- and 360-fold to the right of the reference (black) curve. (B) For simulating the ‘delayed association’ data, receptors are pre-incubated for 30 min in medium only or with a fixed concentration (3.10−8 M) of competitor (open symbols) and further incubated for increasing time periods with a fixed concentration (2 nM) of radioligand either in the absence or presence of competitor released at 0.5 or 10% of its initial concentration. Radioligand binding is expressed in percent of control, i.e. binding after 30 min to receptors pretreated with medium only. The calculated competitor dissociation t1/2 and initial receptor occupancy ([CR]t=0) values according to Equation 4 were identical to the input values (9.0 min and 97.5% of [Rtot]) in case of no competitor release (red curve) but diverged more and more with increasing competitor release (blue curve for 0.5% release: 11.3 min and 90.3%; green solid curve for 10% release: 82 min and 78.2%). In case of 10% competitor release, the data fitted better with a mono-exponential association paradigm (dotted green curve) in where only 44.5% of the control radioligand binding was recoverable. TSC, two-step competition.
