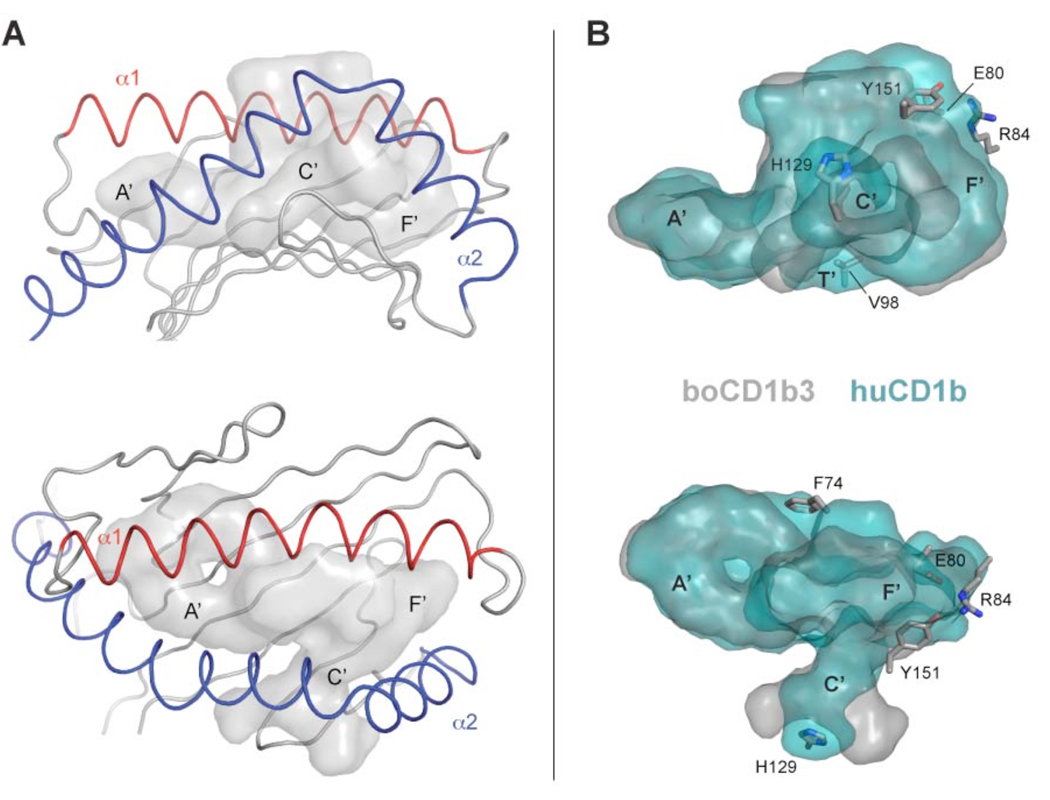
Figure 2.
Architecture of the binding groove of boCD1b3 and comparison with huCD1b. A, The antigen-binding domain of boCD1b3, side and top view, is shown with the α1 and α2 helices indicated in red and blue respectively. The surface of the transparent antigen-binding groove is rendered in grey with the main pockets A’, F’ and the C’ portal labeled. B, Side and top view of the superposed huCD1b (PDB ID 1UQS, cyan) and boCD1b3 (grey) binding pocket. The boCD1b3 residues, which limit the pocket shape compared to huCD1b are shown in sticks representation. Side views are shown in the top row and top views are below.

