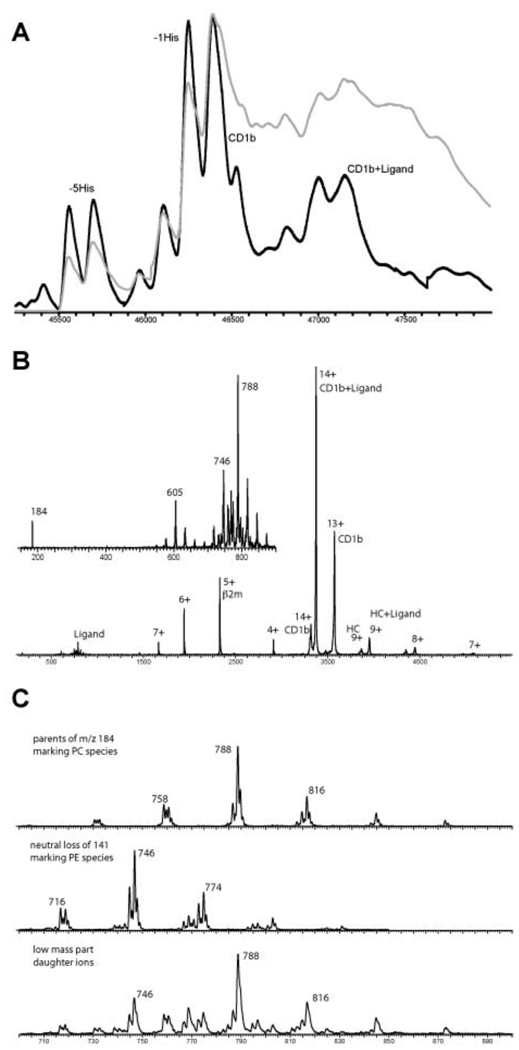
Figure 3.
Mass analysis of the lipid ligands in boCD1b3. A, Deconvoluted mass spectra at high (black) and low (grey) desolvation energy. B, Tandem MS spectrum of the selected 14+ precursor ions of the intact non-covalent complex of boCD1b3 and the lipid ligands (CD1b+Ligand). The low mass range inset of this tandem MS spectrum is showing m/z 184, phosphatidylcholine (PC) marker ion and m/z 788 as his most intense parent ion and further m/z 746 and his 141 Da neutral loss at m/z 605 from phosphatidylethanolamine (PE). C, The panel presents, respectively, the parent ion scan of m/z 184 giving the PC species, the neutral loss scan of 141 Da giving the PE species and for the same mass range the fragment ion spectrum of the complex of boCD1b3 and the lipids.

