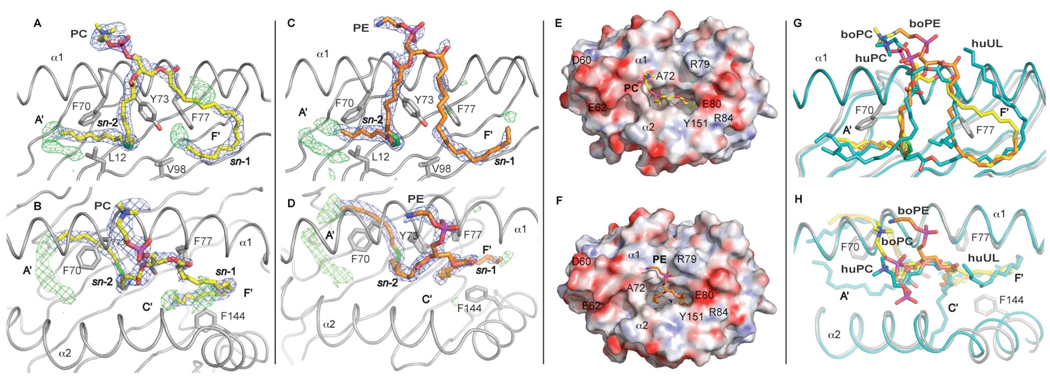
Figure 4.
Endogenous ligands PC (A, B, E) and PE (C, D, F) bound to boCD1b3. A side view is presented with the α2 helix removed for clarity (A, C, G) together with the corresponding top view (B, D, E, F, H). A, B, C, D, The 2Fo-Fc electron density for the ligand, contoured at 1σ, is shown as a blue mesh. Some of the residues involved in the binding of the ligand and in the formation of the hydrophobic pocket are also depicted. The alkyl chain at the sn-1 position is inserted in the F’ pocket while alkyl chain at the sn-2 position, with the unsaturation shown in green, partially fills the A’ pocket. Positive difference density (Fo-Fc map contoured at 3σ and shown as green mesh) is visible at the bottom of the A’ pocket and, to a lesser extent, in the F’ pocket, possibly indicating lower occupancy species, such as ligands with a C24:1 fatty acid present in the binding groove, or possibly a C8 spacer ligand. E and F, Top view of the boCD1b3 binding pocket with the protein shown as a molecular surface with electrostatic potential (electronegative in red and electropositive in blue from −30 kT/e to 30 kT/e). The PC and PE ligands are shown in yellow and orange respectively. G and H, Top and side views of the superposed boCD1b3 (in grey) and human CD1b (PDB ID 2H26, in cyan) binding grooves in cartoon representation. The boCD1b3 ligands boPC and boPE (yellow and orange, respectively) are compared to the huPC and long spacer (huUL, human Unidentified Ligand, both in cyan) observed in the huCD1b structure.

