Figure 4.
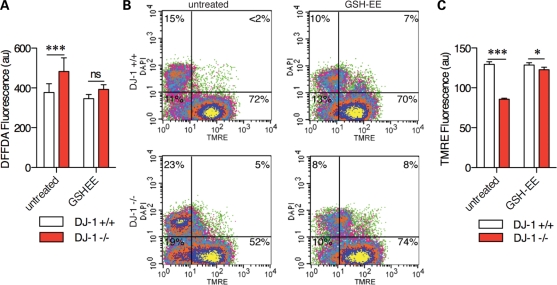
Endogenous oxidative stress contributes to mitochondrial phenotypes in DJ-1-deficient MEFs. (A) ROS were measured in living cells using the fluorescent dye DFFDA. Under basal conditions, DJ-1 knockout MEFs (red boxes) had higher DFFDA signals than wild-type lines (black boxes). DFFDA signals were lower, and differences between the lines were not seen when the cells were pretreated for 24 h with 100 μm GSH-EE prior to imaging. Two-way ANOVA was used to compare cell lines and treatments as separate factors and then Bonferroni post hoc tests were used to compare cell lines for each treatment; ***P < 0.001; ns, not significant. (B) TMRE and DAPI were used to estimate mitochondrial membrane potential and nuclear integrity in knockout MEFs (lower panels). Treatment with GSH-EE (right pair of panels) increased the proportion of DJ-1 knockout MEFs with higher TMRE staining compared with controls. (C) Cells were treated with GSH-EE and mitochondrial membrane potential imaged using TMRE. DJ-1 knockout cells (red) bars had lower TMRE signals compared with wild-type lines (open bars) and this difference was diminished after treatment with GSH-EE. Two-way ANOVA was used to compare cell lines and treatments as separate factors and then Bonferroni post hoc tests were used to compare cell lines for each treatment; ***P < 0.001; ns, not significant.

