Figure 4.
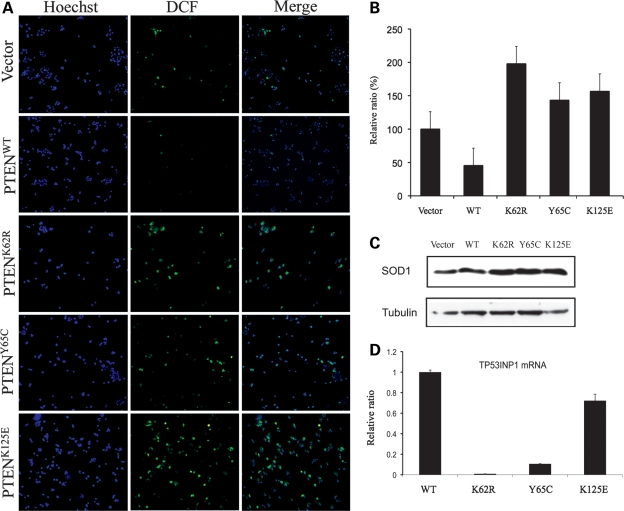
PTEN ATP-binding mutations increase ROS production and SOD1 expression. (A) MCF-7 cells stably expressing empty vector, PTENWT or PTEN ATP binding mutants were incubated with 25 μm Carboxy-H2DCFDA for 30 min and immunofluorescent images were taken for ROS production (green). DNA was counterstained with Hoechst 33342 (blue). (B) Quantitation of immunofluorescence intensity of DCF [from (A)] in MCF-7 cells overexpressing PTENWT and mutants. The data represent the average of three independent measurements. P < 0.01, one-way ANOVA. (C) SOD1 protein was detected in cell lines expressing WT or mutant PTEN by western blot. (D) Total RNA from MCF-7 cells overexpressing WT or mutant PTEN was extracted and qRT–PCR was performed to measure TP53INP1 mRNA levels. P < 0.01, one-way ANOVA.

