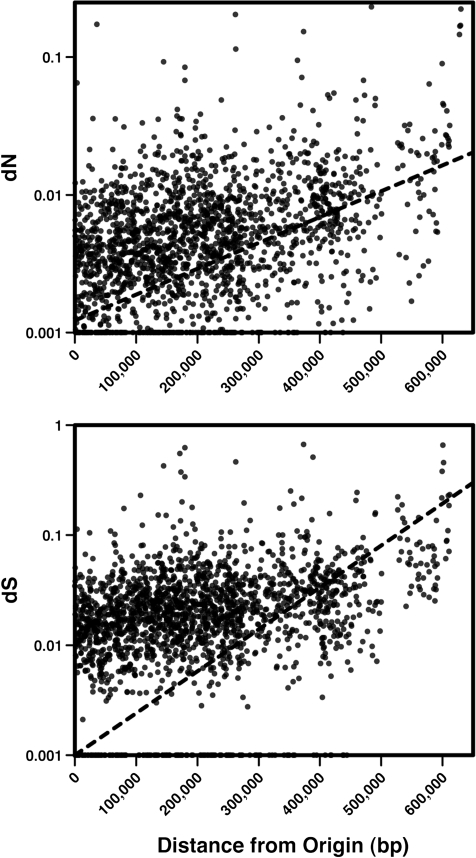
FIG. 3.—
Linear regressions of (A) the rate of nonsynonymous substitutions (dN) and (B) the rate of synonymous substitutions (dS) among panortholog families on their distance from the nearest replication origin. The dotted line depicts the linear regression function; each is statistically significant (dN: F = 179.7, P < 0.001; dS: F = 39.7, P < 0.001) despite modest explanatory power (dN: r2 = 0.083; dS: r2 = 0.02). Ortholog position was assigned using the Sulfolobus islandicus L.S.2.15 genome, which is justified by the high degree of synteny among the six study genomes (supplementary fig. S2, Supplementary Material online).

