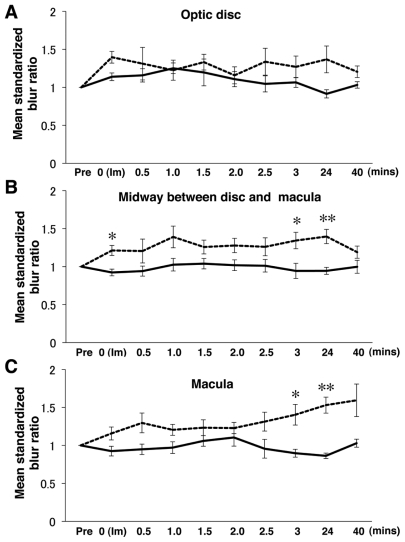
Figure 2.
Changes of the mean standardized blur ratio in volunteers with (n = 6) or without (n = 4) TES (mean ± SEM). Dash lines indicate the TES group and solid lines the sham stimulation group. A) In optic disc area, there were no significant differences between the sham stimulation and TES at any times. B) However, for the point located midway between the optic disc and macula, the mean standardized blur ratio was significantly increased at immediate, 3, and 24 h after TES. C) Similarly in the macula area, the mean standardized blur ratio was significantly increased at 3 and 24 h after TES.
Notes: Statistical analysis was performed by two-way repeated measures ANOVA post hoc unpaired t test, *P < 0.05, **P < 0.01. The mean standardized blur ratio was calculated as the ratio of the standardized SBR, which was the ratio of the stimulated eye to the fellow eye, at each measurement point to that of prestimulation at the baseline.

