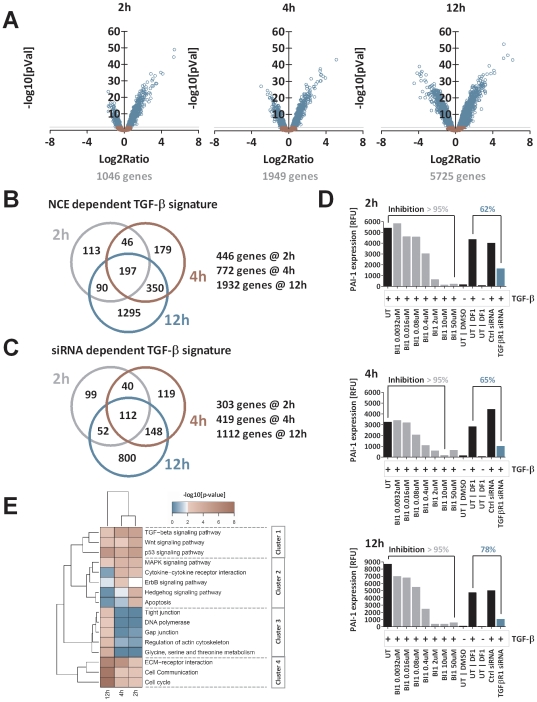
Figure 3. On-target Signature.
The on-target signature was generated based on gene regulations upon treatment with TGF-β, TGF-βR1-kinase inhibitors (NCEs) or a siRNA. A: Volcano plots of the comparison between TGF-β stimulated and non stimulated cells at 2 h, 4 h & 12 h. Every circle represent a single transcript. The x-axis shows the log2 ratio (LR) between TGF-β stimulated vs. untreated HaCaT cells. The y-axis is scaled as negative log10 [p-value] as an indicator of significance. P-values were FDR-corrected according to Benjamini-Hochberg. Blue circled genes are significantly regulated by the stimulation with TGF-β (p-value <0.01). B: The list of non-redundant genes was filtered for a dose-dependent regulation upon NCE treatment and TGF-β stimulation.: 446, 772 and 1932 genes were identified as the NCE-dependent on target TGF-β signature after 2 h, 4 h and 12 h. C: The siRNA dependent TGF-β signature identified 307, 419 and 1112 genes which were classified as siRNA-dependent on-target TGF-β signature genes after 2 h, 4 h and 12 h. D: Expression level of PAI-1 mRNA as a surrogate marker for TGF-β signaling pathway activity after treatment with NCE B1 or siRNA. Treatment with NCE BI1 resulted in a complete knockdown of PAI-1 expression (>95%) for all time points. In contrast the siRNA A1 mediated knockdown of the TGF-β signaling only reduced PAI-1 levels partially to 62%, 65% and 78% after 2 h, 4 h and 12 h of TGF-β stimulation. E: Gene set enrichment analysis (GSEA) using KEGG gene annotation resulted in 16 significantly affected genesets/signaling pathways. Clustering of -log10[p-values] using complete linkage and manhattan distance resulted in four major clusters: immediate early affected pathways (cluster 2) permanently affected pathways with emphases at early (cluster 1) and late time points (cluster 4) or late established events (cluster 3). The color code defines the significance determined by Fisher's exact test: blue <2 – not significant; white = 2 – significant & red >2 – highly significant).

