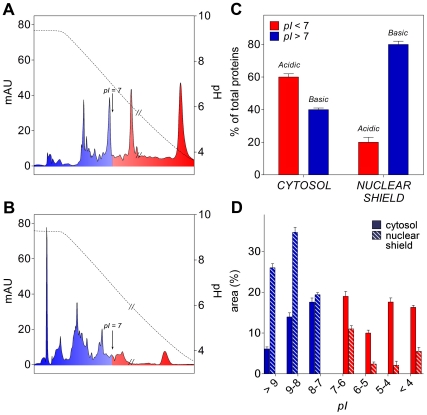
Figure 3. Isoelectrofocusing experiments.
(A) Combined chromatogram of the cytosolic proteins obtained from two runs at different pH ranges (i.e. pH 9.0–6.0 and pH 7.0–4.0). The double slash shows the connection zone of the two chromatograms. Blue area indicates the basic proteins and red area the acidic proteins. Dotted line represents the pH gradient. (B) Combined chromatogram of the nuclear shield proteins. (C) Acid-base properties of nuclear shield and cytosolic proteins. (D) Percent of acidic and basic proteins grouped in discrete pI ranges as derived by the experiments shown in A and B.

