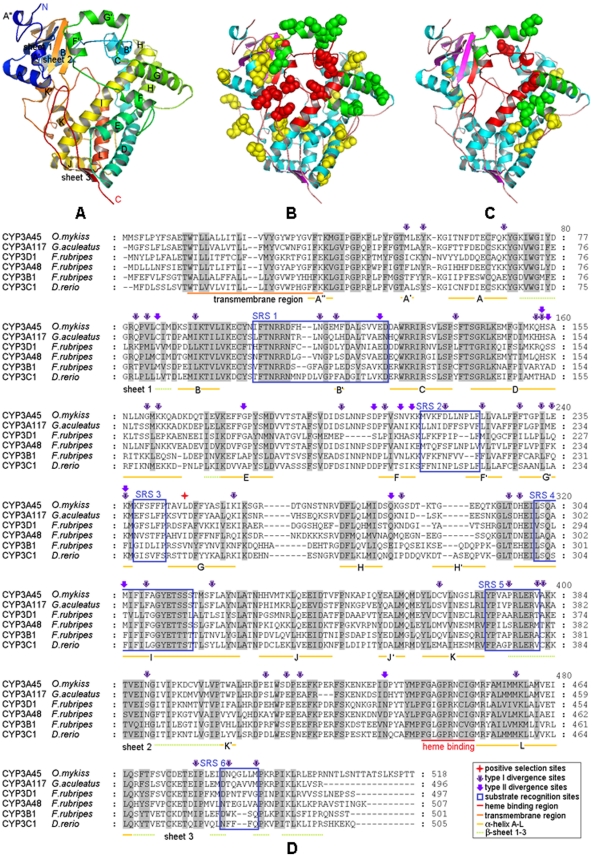
Figure 3. Protein structure of Actinopterygii CYP3 family.
(A) Model of O. mykiss CYP3A45 protein based on homology modeling. (B) Positions of type-I sites in the model. Type-I sites are shown as spheres; SRS, red; helix F-G, green. (C) Positions of type-II sites in the model. Type-II sites are shown as spheres colored as in (B). (D) An example of multi-alignment of Actinopterygii CYP3 family amino acid sequences. Conserved sites are shaded and the meaning of each symbol is given in the box.

