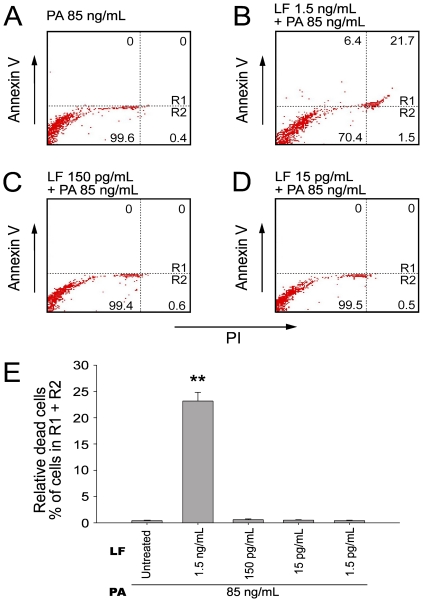
Figure 2. Flow cytometry analysis for LT-induced cell death of macrophage cells.
Flow cytometry analysis was employed to determine the cell death of macrophage cells (A–D). After 3-hour treatments of various concentrations of LT, mouse macrophage J774A.1 cells were stained with annexin V-APC and PI. The upper right quadrants (Rl) and the lower right quadrants (R2) were positive for PI uptake representing the non-viable cells (A–D). One representative diagram out of three experiments is showed, in which the percentage of cells in each quadrant was indicated (A–D). The quantitative results of relative dead cells (% of cell subpopulations in R1 + R2) are presented as mean ± standard deviation (E). ** P<0.01, compared to the PA control groups (LF untreated).

