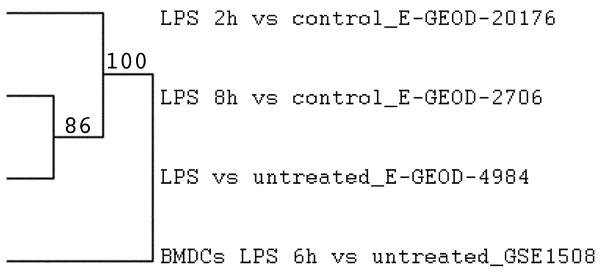
Figure 5.
Pathway analysis on microarray data on human or mouse DCs stimulated with TLR ligands. Dendogram of PEF cluster and score using Euclidean distance using support trees on human moDC or mouse bone marrow derived DCs (BMDCs) stimulated with LPS. The numbers next to the tree indicate the support (significance): higher values mean higher significance. The total matrix used for clustering is available as Additional file 8.

